Wed, Jul 16, 2025
Volume 16, Issue 2 (Summer & Autumn 2019)
ASJ 2019, 16(2): 77-86 |
Back to browse issues page

Download citation:
BibTeX | RIS | EndNote | Medlars | ProCite | Reference Manager | RefWorks
Send citation to:


BibTeX | RIS | EndNote | Medlars | ProCite | Reference Manager | RefWorks
Send citation to:
Vosugh D, Nazem M N, Lahuti S. Anatomy and Ultrasonographic Morphometric Measurements of Palmar Metacarpal Tendons and Ligaments in Pure Persian Arabian Horses. ASJ 2019; 16 (2) :77-86
URL: http://anatomyjournal.ir/article-1-185-en.html
URL: http://anatomyjournal.ir/article-1-185-en.html


1- Department of Clinical Sciences, Faculty of Veterinary Medicine, Shahid Bahonar University of Kerman, Kerman, Iran.
Full-Text [PDF 564 kb]
(3752 Downloads)
| Abstract (HTML) (3810 Views)

Relationships between the sizes of structures
Significant differences between the structures of each region were determined. At the 3rd region, the body of SL had the largest values for the cross-sectional area, followed by the DDFT and the accessory ligament of DDFT; the SDFT had the lowest cross-sectional area values. Distally, the DDFT obtained the largest values for this variable; values of the SL branches were approximately 30% and 40% of the DDFT value at regions 4 and 5, respectively. The smallest value for the cross-sectional area was found in the SDFT. At region 3, the DDFT had the smallest value and the SL had the highest. At regions 4 and 5, the SDFT had the highest circumference values, followed by the DDFT.

Full-Text: (7043 Views)
1. Introduction
Arabian (Arab) horse is a breed of horse originated from Arabian Peninsula. This breed is among the most famous strains of horses in the world. It is also one of the first breeds of horses in the Middle East with 4500 years of history. War and trade resulted in the spread of Arabian horses around the world. Parameters such as speed and strong bones affected the insemination of this breed with other equine breeds. Arabian bloodlines are presented in almost all riding horse breeds [1].
Considering the importance of horse’s musculoskeletal system, it is necessary to have a comprehensive understanding of under strain anatomical structures, as well as risk factors for injury as a basis for future veterinary care [2]. Numerous studies described the anatomy of flexor tendons and ligaments of the palmar metacarpal region in horses [3, 4] and donkeys [5].
Ultrasonography has been used in the diagnosis of tendon and ligament injuries for nearly 25 years. However, with technological advances and decreased equipment costs, this imaging modality is more useful and readily available in practice. Producing highest quality images is necessary for the clinicians to maximize the obtained diagnostic information [2]. Ultrasonography is an appropriate method to diagnose the tendon and ligament injuries in horses [6]. To use this method, obtaining complete information about the normal values of special breed of horses is necessary [7].
Tendon enlargement is often the only finding in early or subclinical cases and the enlargements of <20% should be regarded as clinically significant. Therefore, it is important to recognize the normal Ultrasonographic tendon/ligament dimensions for an accurate and definite diagnosis. Referred measurements are valuable and objective methods to interpret tendon enlargement. The evaluation of these measurements is relevant with the healing process follow-up in tendon/ligament injuries [7].
Given that differences between breeds have been reported in the literature [8-10], the current research aimed to provide basic reference values for the tendons and ligaments in the palmar metacarpal region of mature pure Persian Arabian horses. These data may be useful for clinicians and researchers
2. Materials and Methods
This study was approved by the Animal Ethics Committee of the Research Council of the Veterinary School in Shahid Bahonar University of Kerman, Iran. Ten 4- 9-year-old pure Persian Arabian mare horses with the height of (measured at the highest point of the withers) 157-162 cm and body weight of 450 to 570 kg were included in this study. The animals were not related to each other.
The clinical examination was performed prior to the Ultrasonographic assessment in all horses. The most attention was on the forelimb tendons and ligaments, especially in the metacarpal region. For this purpose, the metacarpal tendons and ligaments were palpated in a weight-bearing position and only the horses without any lameness signs were selected for studying.
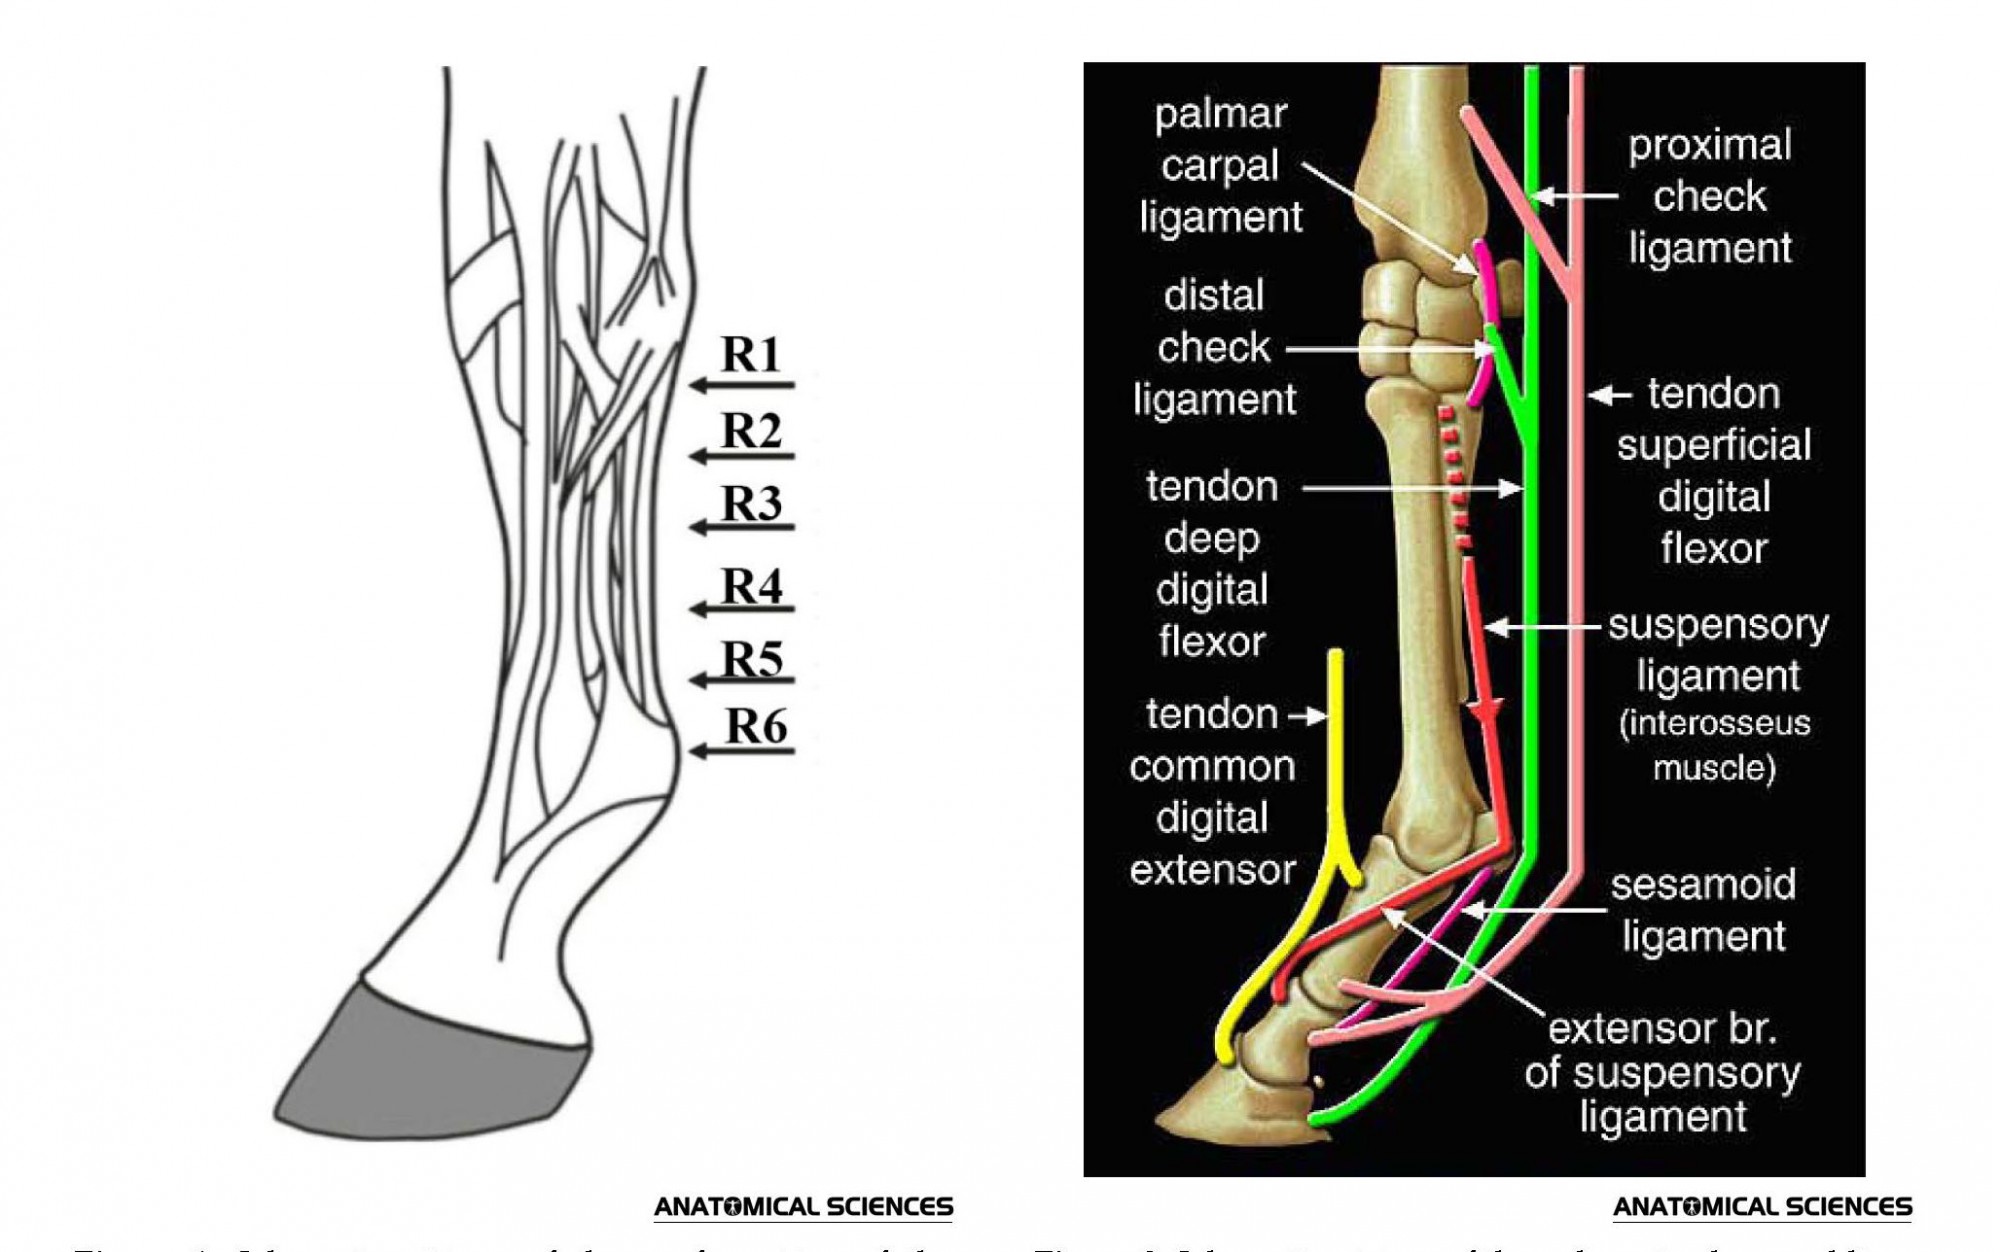
The horses were prepared for the examination as follows: the lateral and medial parts of the metacarpal region from the upper part of the lateral splint to the ergot were shaved after applying a generous amount of foam to the skin. The area was cleaned using alcohol to remove any epidural fat deposition. The shaved area was divided into 6 regions (Figure 1) (R1, R2, R3, R4, R5, R6) [5, 7]. They were marked at the lateral part of the clipped area with an animal marker crayon.
The ultrasonography of right and left metacarpal regions was performed using a Pie Medical 100 Falco vet and an 8 MHz linear transducer. The above area was Ultrasonographically examined in both transverse and longitudinal appearances with the same power, depth, and focus of the machinery. The detection of tendons and ligaments structures was demonstrated in comparison with the anatomical and diagnostic imaging reference books [11, 12]. The structures assessed from palmar to dorsal were the Superficial Digital Flexor Tendon (SDFT), Deep Digital Flexor Tendon (DDFT), Inferior Check Ligament (ICL), Suspensory Ligament (SL), as well as its lateral and medial branches (Lat. SL and Med. SL).
During the study, the focus was attuned to reach the best quality of the scans. For better description of the images, a palmar metacarpal region of one Anatolian donkey euthanized was dissected. First, the skin and superficial fascia, then deep fascia were removed. The carpal canal was opened at the palmar surface by cutting the flexor retinaculum to detect its passing tendons and structures. Finally, tendons and ligaments at the palmar surface of metacarpus were dissected and separately named from antebrachium to fetlock joint based on previous studies (Figure 2) [3, 4]. Findings of this part were used to interpret the Ultrasonographic images.
The ultrasonograms of the left and right limbs were analyzed by Ultrasonographic system. For each structure at each region, one operator recorded the following variables: cross-sectional area (cm2), circumference (cm), dorsopalmar width (cm), and lateromedial width (cm). In regions 3, 4, and 5, the lateromedial width of SDFT was not measured with a straight line like the proximal regions, but with a curved line through the middle of tendon following its natural shape to measure the real width of structure. All other dorsopalmar and lateromedial width measurements were obtained by a straight line connecting the 2 points on the circumference farthest apart from each other. The echogenicity of each tendon/ligament was interpreted in comparison with other structures. In addition, the obtained scans were compared with previous studies [3-5].
Statistical analysis
The obtained data were statistically analyzed using SPSS. The significance level was set at P=0.05. To compare the data between 6 regions of each structure, one-way Analysis of Variance (ANOVA) was used. Tukey’s test following ANOVA was used to evaluate the differences between groups. Moreover, t-test was used to analyse the structures data of right and left forelimb.
3. Results
Anatomical descriptions
The suspensory ligament took the form of a uniform ligament which passed between the two splint bones. This ligament was divided into 2 diverging branches inserted on the proximal concave abaxial surfaces of sesamoid bones. Each branch was obliquely and laterally extended to medial to join the common digital extensor tendon on the dorsal aspect of the first phalanx.
Superficial Digital Flexor (SDF) muscle seemed like a strong tendon at carpal joint, where it merged with Superior Check Ligament (SCL) which originated from the radius at the caudomedial surface. It distally ran through the palmar surface of carpal canal to this surface of the metacarpus. Superficial Digital Flexor Tendon (SDFT) was placed medial to the Deep Digital Flexor Tendon (DDFT) in the carpus (Figure 2).
DDFT passed from the palmar region of the carpus, medial to the splint bone. Then, DDFT was changed to a roundish tendon and placed close to the SDFT. In the upper quadrant of metacarpus, the Inferior Check Ligament (ICL) which was originated from the deep fascia of palmar carpal ligament was connected to it (Figure 2). In the distal extremity of metacarpus, and above the sesamoid bones, the SDFT formed a ring-shaped cuff around the DDFT. The 2 tendons were closely related as they continued to the fetlock. The palmar metacarpal tendons and ligaments are illustrated in Figure 2.
Ultrasonography
Because of the noticeable degree of acoustic impedance difference, the bone near the soft tissues demonstrated an appropriate echogenicity. Thus, it appears a well-defined white line along the third metacarpal border and the proximal sesamoid bones. Because of the reflection of sound waves some slight echoes were observed below this bone (Figures 3 and 4).
The echoes of soft tissues adjacent were weak because of lacking a noticeable degree of acoustic impedance. The flexor tendons demonstrated the same direct outline with slim, longitudinal internal echoes (Figures 3 and 4). These direct echoes were regulated parallel to the long axis of these tendons. There was acoustic impedance between the flexor tendons all the way through their length in longitudinal approaches. This was attained with the small handling of transducer. The linear organization of ICL was similar in DDFT and SDFT. Because of the ICL sole merging with DDFT at the proximal of bifurcation of the Suspensory Ligament (SL), this part showed unclear scans (Figures 3 and 4). The soft tissues around the SL suggested low echo intensity. It caused a better visualization at the level of SL bifurcation.
Ultrasonographic description
Transverse images
In the transverse images of palmar region, the closest structure to the transducer belongs to the top of image and the most distant one, which is the palmar surface of the metacarpal region, belongs to the lowest part of image.
Region 1
In this level, some parts of the skin, subcutaneous tissues, DDFT, and SDFT were observed. No full image of any structure was recorded. SDFT tends to the medial part in comparison to the DDFT and the longitudinal axis. The echogenicity of SDFT was slightly less than DDFT at this region.
Region 2
No full image of any structure was recorded; however, some parts of the following structures were observed on the screen: skin, subcutaneous tissues, DDFT, and SDFT. SDFT had a crescent shape with thickness in its medial part. It seemed that SDFT tends to the medial part, in comparison to the DDFT and the longitudinal axis. The echogenicity of SDFT was slightly less than DDFT at this region. DDFT had a complete circular shape at this region and the width and thickness of the tendons were almost the same. In the palmar region, SDFT and in the dorsal area, soft tissue and vascular space were observed with a higher echogenicity than SDFT. We determined no ICL and SL in this region.
Region 3
The observed skin and the subcutaneous tissues, DDFT, SDFT, vascular and soft tissue space, SL, and the surface of third metacarpal bone on the top of image. SDFT had a crescent shape and was more significant at this level. The thickness of tendon has increased and the thick part of crescent shape was located medial to DDFT and the longitudinal axis of the limb. The echogenicity of this tendon was somehow less than that of DDFT at this region. DDFT was egg-shaped at this level and its width seemed wider than its thickness. In the palmar part, SDFT and in the dorsal part, vascular and soft tissue spaces were identified. The echogenicity of DDFT was somehow higher than that of SDFT just like the previous levels. Although the presence of suspensory ligament is obvious, no complete and describable image was recorded (Figure 3).
Region 4
All the structures were observable at this level, too. Right from the top, skin and the subcutaneous tissues, SDFT, DDFT, vascular and soft tissue space, SL, and the surface of the third metacarpal bone were identified. To some extent, SDFT had a crescent shape and seemed to be mostly located toward the dorsal part of DDFT and much less toward the medial part. At this level, echogenicity was mostly isoechoic with DDFT. Additionally, DDFT revealed an apparent increase in size with a circular and somehow isoechoic shape with SDFT. The space between DDFT and SL was reduced. SL was more prominent with a rectangular shape and its echogenicity was significantly higher than DDFT and SDFT, which seemed homogeny and steady, as well. The echo of the third metacarpal bone appeared much more notable and hyperechoic (Figure 3).
Region 5
All the structures such as skin, subcutaneous tissues, DDFT, SDFT, vascular and soft tissue space, SL, and the surface of the metacarpal bone were fully observable at this level. SDFT appeared to be narrower; however, its width suggested no marked difference, compared to its width at the previous level. It had a bracket shape with rather sharp edges. The echogenicity of this structure was less than DDFT. SL was clearly observed with limpid borders, a butterfly shape and a narrower width, which seemed close to the branching place of the ligaments. The echogenicity of this structure was slightly higher than SDFT and DDFT (Figure 3).
Region 6
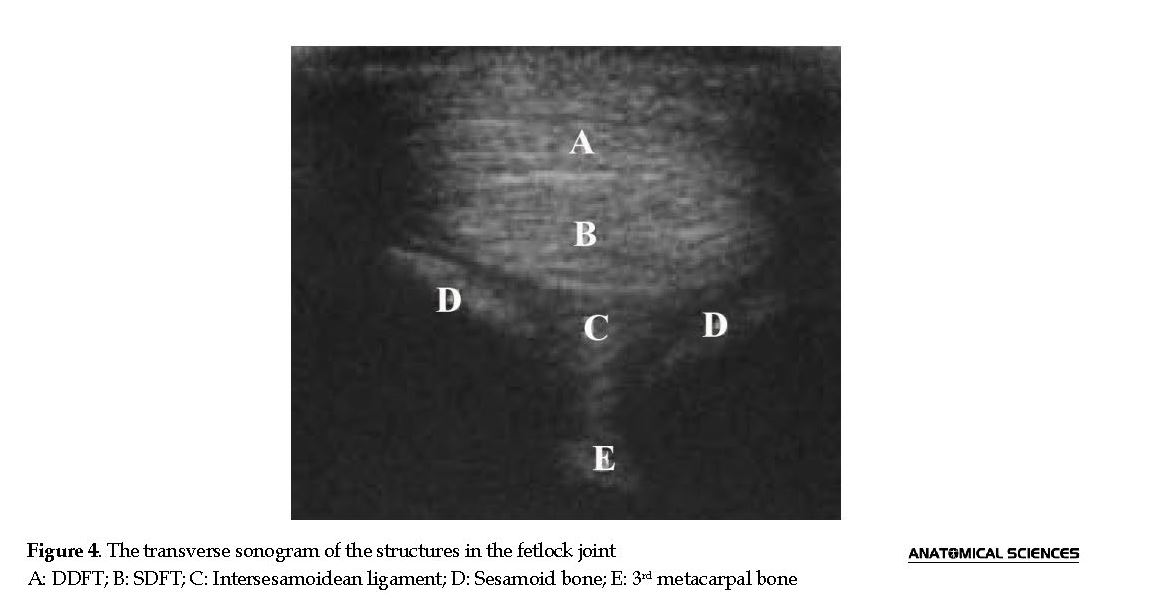
This level was at the fetlock joint and the detectable structures were skin, subcutaneous tissues, DDFT, SDFT, dorsomedial and dorsolateral sesamoids, SL, and the echo of the third metacarpal bone. SDFT seemed narrower than the previous level with an increased width extended to the sides of DDFT. Echogenicity was analogous to DDFT, with an oval and elongated shape and increased width. On the sides and dorsal part of DDFT, 2 echogenic convex lines were identified which were created due to the head of the dorsolateral and dorsomedial sesamoid bones causing the sound between the above structures. Also, dorsal to the DDFT, a rectangular and hyperechoic structure was recognized which was the palmar intersesamoidean ligaments. On the lateral part of this ligament, a small echogenic area/line was observed that was related to the middle condyle of the third metacarpal. Other branches of SL were not observable at this level (Figure 4).
Longitudinal images
In these images, echogenic narrow and parallel lines were observed all over the longitudinal tendons and ligament structure which indicates the fibrous pattern of these structures. In the longitudinal images at region 2, SDFT and second superior check ligament were so close to each other that sometimes the borders were not detectable. In these images, DDFT and ICL were also very close to each other (like previous ligaments). At these levels, vascular and soft tissue spaces were hypoechoic with a lower echogenicity. Moreover, the SL border down the vascular and soft tissue space was fully observable. The surface of the third metacarpal bone was clearly detected as a hyperechoic line. In the longitudinal images and at the regions 3 and 4, DDFT and SDFT were so close to each other where the borders could not be recognized.
Vascular and hypoechoic soft tissue space with a lower echogenicity at the lower part was completely identified. At this level, the suspensory ligament was interrupted at the branching spot of ligament. The rest of SL branches were not observable in the longitudinal view of the middle of metacarpus. If the transducer was positioned longitudinally and leaned to the medial or lateral side of metacarpus, the branches of SL were observable which appeared to be echogenic and hemogenic. At the last level, the longitudinal view of SDFT and DDFT were observed and the metacarpal bone surface and the intercondylar process of the third metacarpal were observed as an echogenic line (Figure 3). There was no differences between right and left forelimbs measurements (P>0.05) (Table 1).
Arabian (Arab) horse is a breed of horse originated from Arabian Peninsula. This breed is among the most famous strains of horses in the world. It is also one of the first breeds of horses in the Middle East with 4500 years of history. War and trade resulted in the spread of Arabian horses around the world. Parameters such as speed and strong bones affected the insemination of this breed with other equine breeds. Arabian bloodlines are presented in almost all riding horse breeds [1].
Considering the importance of horse’s musculoskeletal system, it is necessary to have a comprehensive understanding of under strain anatomical structures, as well as risk factors for injury as a basis for future veterinary care [2]. Numerous studies described the anatomy of flexor tendons and ligaments of the palmar metacarpal region in horses [3, 4] and donkeys [5].
Ultrasonography has been used in the diagnosis of tendon and ligament injuries for nearly 25 years. However, with technological advances and decreased equipment costs, this imaging modality is more useful and readily available in practice. Producing highest quality images is necessary for the clinicians to maximize the obtained diagnostic information [2]. Ultrasonography is an appropriate method to diagnose the tendon and ligament injuries in horses [6]. To use this method, obtaining complete information about the normal values of special breed of horses is necessary [7].
Tendon enlargement is often the only finding in early or subclinical cases and the enlargements of <20% should be regarded as clinically significant. Therefore, it is important to recognize the normal Ultrasonographic tendon/ligament dimensions for an accurate and definite diagnosis. Referred measurements are valuable and objective methods to interpret tendon enlargement. The evaluation of these measurements is relevant with the healing process follow-up in tendon/ligament injuries [7].
Given that differences between breeds have been reported in the literature [8-10], the current research aimed to provide basic reference values for the tendons and ligaments in the palmar metacarpal region of mature pure Persian Arabian horses. These data may be useful for clinicians and researchers
2. Materials and Methods
This study was approved by the Animal Ethics Committee of the Research Council of the Veterinary School in Shahid Bahonar University of Kerman, Iran. Ten 4- 9-year-old pure Persian Arabian mare horses with the height of (measured at the highest point of the withers) 157-162 cm and body weight of 450 to 570 kg were included in this study. The animals were not related to each other.
The clinical examination was performed prior to the Ultrasonographic assessment in all horses. The most attention was on the forelimb tendons and ligaments, especially in the metacarpal region. For this purpose, the metacarpal tendons and ligaments were palpated in a weight-bearing position and only the horses without any lameness signs were selected for studying.
The horses were prepared for the examination as follows: the lateral and medial parts of the metacarpal region from the upper part of the lateral splint to the ergot were shaved after applying a generous amount of foam to the skin. The area was cleaned using alcohol to remove any epidural fat deposition. The shaved area was divided into 6 regions (Figure 1) (R1, R2, R3, R4, R5, R6) [5, 7]. They were marked at the lateral part of the clipped area with an animal marker crayon.
The ultrasonography of right and left metacarpal regions was performed using a Pie Medical 100 Falco vet and an 8 MHz linear transducer. The above area was Ultrasonographically examined in both transverse and longitudinal appearances with the same power, depth, and focus of the machinery. The detection of tendons and ligaments structures was demonstrated in comparison with the anatomical and diagnostic imaging reference books [11, 12]. The structures assessed from palmar to dorsal were the Superficial Digital Flexor Tendon (SDFT), Deep Digital Flexor Tendon (DDFT), Inferior Check Ligament (ICL), Suspensory Ligament (SL), as well as its lateral and medial branches (Lat. SL and Med. SL).
During the study, the focus was attuned to reach the best quality of the scans. For better description of the images, a palmar metacarpal region of one Anatolian donkey euthanized was dissected. First, the skin and superficial fascia, then deep fascia were removed. The carpal canal was opened at the palmar surface by cutting the flexor retinaculum to detect its passing tendons and structures. Finally, tendons and ligaments at the palmar surface of metacarpus were dissected and separately named from antebrachium to fetlock joint based on previous studies (Figure 2) [3, 4]. Findings of this part were used to interpret the Ultrasonographic images.
The ultrasonograms of the left and right limbs were analyzed by Ultrasonographic system. For each structure at each region, one operator recorded the following variables: cross-sectional area (cm2), circumference (cm), dorsopalmar width (cm), and lateromedial width (cm). In regions 3, 4, and 5, the lateromedial width of SDFT was not measured with a straight line like the proximal regions, but with a curved line through the middle of tendon following its natural shape to measure the real width of structure. All other dorsopalmar and lateromedial width measurements were obtained by a straight line connecting the 2 points on the circumference farthest apart from each other. The echogenicity of each tendon/ligament was interpreted in comparison with other structures. In addition, the obtained scans were compared with previous studies [3-5].
Statistical analysis
The obtained data were statistically analyzed using SPSS. The significance level was set at P=0.05. To compare the data between 6 regions of each structure, one-way Analysis of Variance (ANOVA) was used. Tukey’s test following ANOVA was used to evaluate the differences between groups. Moreover, t-test was used to analyse the structures data of right and left forelimb.
3. Results
Anatomical descriptions
The suspensory ligament took the form of a uniform ligament which passed between the two splint bones. This ligament was divided into 2 diverging branches inserted on the proximal concave abaxial surfaces of sesamoid bones. Each branch was obliquely and laterally extended to medial to join the common digital extensor tendon on the dorsal aspect of the first phalanx.
Superficial Digital Flexor (SDF) muscle seemed like a strong tendon at carpal joint, where it merged with Superior Check Ligament (SCL) which originated from the radius at the caudomedial surface. It distally ran through the palmar surface of carpal canal to this surface of the metacarpus. Superficial Digital Flexor Tendon (SDFT) was placed medial to the Deep Digital Flexor Tendon (DDFT) in the carpus (Figure 2).
DDFT passed from the palmar region of the carpus, medial to the splint bone. Then, DDFT was changed to a roundish tendon and placed close to the SDFT. In the upper quadrant of metacarpus, the Inferior Check Ligament (ICL) which was originated from the deep fascia of palmar carpal ligament was connected to it (Figure 2). In the distal extremity of metacarpus, and above the sesamoid bones, the SDFT formed a ring-shaped cuff around the DDFT. The 2 tendons were closely related as they continued to the fetlock. The palmar metacarpal tendons and ligaments are illustrated in Figure 2.
Ultrasonography
Because of the noticeable degree of acoustic impedance difference, the bone near the soft tissues demonstrated an appropriate echogenicity. Thus, it appears a well-defined white line along the third metacarpal border and the proximal sesamoid bones. Because of the reflection of sound waves some slight echoes were observed below this bone (Figures 3 and 4).
The echoes of soft tissues adjacent were weak because of lacking a noticeable degree of acoustic impedance. The flexor tendons demonstrated the same direct outline with slim, longitudinal internal echoes (Figures 3 and 4). These direct echoes were regulated parallel to the long axis of these tendons. There was acoustic impedance between the flexor tendons all the way through their length in longitudinal approaches. This was attained with the small handling of transducer. The linear organization of ICL was similar in DDFT and SDFT. Because of the ICL sole merging with DDFT at the proximal of bifurcation of the Suspensory Ligament (SL), this part showed unclear scans (Figures 3 and 4). The soft tissues around the SL suggested low echo intensity. It caused a better visualization at the level of SL bifurcation.
Ultrasonographic description
Transverse images
In the transverse images of palmar region, the closest structure to the transducer belongs to the top of image and the most distant one, which is the palmar surface of the metacarpal region, belongs to the lowest part of image.
Region 1
In this level, some parts of the skin, subcutaneous tissues, DDFT, and SDFT were observed. No full image of any structure was recorded. SDFT tends to the medial part in comparison to the DDFT and the longitudinal axis. The echogenicity of SDFT was slightly less than DDFT at this region.
Region 2
No full image of any structure was recorded; however, some parts of the following structures were observed on the screen: skin, subcutaneous tissues, DDFT, and SDFT. SDFT had a crescent shape with thickness in its medial part. It seemed that SDFT tends to the medial part, in comparison to the DDFT and the longitudinal axis. The echogenicity of SDFT was slightly less than DDFT at this region. DDFT had a complete circular shape at this region and the width and thickness of the tendons were almost the same. In the palmar region, SDFT and in the dorsal area, soft tissue and vascular space were observed with a higher echogenicity than SDFT. We determined no ICL and SL in this region.
Region 3
The observed skin and the subcutaneous tissues, DDFT, SDFT, vascular and soft tissue space, SL, and the surface of third metacarpal bone on the top of image. SDFT had a crescent shape and was more significant at this level. The thickness of tendon has increased and the thick part of crescent shape was located medial to DDFT and the longitudinal axis of the limb. The echogenicity of this tendon was somehow less than that of DDFT at this region. DDFT was egg-shaped at this level and its width seemed wider than its thickness. In the palmar part, SDFT and in the dorsal part, vascular and soft tissue spaces were identified. The echogenicity of DDFT was somehow higher than that of SDFT just like the previous levels. Although the presence of suspensory ligament is obvious, no complete and describable image was recorded (Figure 3).
Region 4
All the structures were observable at this level, too. Right from the top, skin and the subcutaneous tissues, SDFT, DDFT, vascular and soft tissue space, SL, and the surface of the third metacarpal bone were identified. To some extent, SDFT had a crescent shape and seemed to be mostly located toward the dorsal part of DDFT and much less toward the medial part. At this level, echogenicity was mostly isoechoic with DDFT. Additionally, DDFT revealed an apparent increase in size with a circular and somehow isoechoic shape with SDFT. The space between DDFT and SL was reduced. SL was more prominent with a rectangular shape and its echogenicity was significantly higher than DDFT and SDFT, which seemed homogeny and steady, as well. The echo of the third metacarpal bone appeared much more notable and hyperechoic (Figure 3).
Region 5
All the structures such as skin, subcutaneous tissues, DDFT, SDFT, vascular and soft tissue space, SL, and the surface of the metacarpal bone were fully observable at this level. SDFT appeared to be narrower; however, its width suggested no marked difference, compared to its width at the previous level. It had a bracket shape with rather sharp edges. The echogenicity of this structure was less than DDFT. SL was clearly observed with limpid borders, a butterfly shape and a narrower width, which seemed close to the branching place of the ligaments. The echogenicity of this structure was slightly higher than SDFT and DDFT (Figure 3).
Region 6
This level was at the fetlock joint and the detectable structures were skin, subcutaneous tissues, DDFT, SDFT, dorsomedial and dorsolateral sesamoids, SL, and the echo of the third metacarpal bone. SDFT seemed narrower than the previous level with an increased width extended to the sides of DDFT. Echogenicity was analogous to DDFT, with an oval and elongated shape and increased width. On the sides and dorsal part of DDFT, 2 echogenic convex lines were identified which were created due to the head of the dorsolateral and dorsomedial sesamoid bones causing the sound between the above structures. Also, dorsal to the DDFT, a rectangular and hyperechoic structure was recognized which was the palmar intersesamoidean ligaments. On the lateral part of this ligament, a small echogenic area/line was observed that was related to the middle condyle of the third metacarpal. Other branches of SL were not observable at this level (Figure 4).
Longitudinal images
In these images, echogenic narrow and parallel lines were observed all over the longitudinal tendons and ligament structure which indicates the fibrous pattern of these structures. In the longitudinal images at region 2, SDFT and second superior check ligament were so close to each other that sometimes the borders were not detectable. In these images, DDFT and ICL were also very close to each other (like previous ligaments). At these levels, vascular and soft tissue spaces were hypoechoic with a lower echogenicity. Moreover, the SL border down the vascular and soft tissue space was fully observable. The surface of the third metacarpal bone was clearly detected as a hyperechoic line. In the longitudinal images and at the regions 3 and 4, DDFT and SDFT were so close to each other where the borders could not be recognized.
Vascular and hypoechoic soft tissue space with a lower echogenicity at the lower part was completely identified. At this level, the suspensory ligament was interrupted at the branching spot of ligament. The rest of SL branches were not observable in the longitudinal view of the middle of metacarpus. If the transducer was positioned longitudinally and leaned to the medial or lateral side of metacarpus, the branches of SL were observable which appeared to be echogenic and hemogenic. At the last level, the longitudinal view of SDFT and DDFT were observed and the metacarpal bone surface and the intercondylar process of the third metacarpal were observed as an echogenic line (Figure 3). There was no differences between right and left forelimbs measurements (P>0.05) (Table 1).
Relationships between the sizes of structures
Significant differences between the structures of each region were determined. At the 3rd region, the body of SL had the largest values for the cross-sectional area, followed by the DDFT and the accessory ligament of DDFT; the SDFT had the lowest cross-sectional area values. Distally, the DDFT obtained the largest values for this variable; values of the SL branches were approximately 30% and 40% of the DDFT value at regions 4 and 5, respectively. The smallest value for the cross-sectional area was found in the SDFT. At region 3, the DDFT had the smallest value and the SL had the highest. At regions 4 and 5, the SDFT had the highest circumference values, followed by the DDFT.
The dorsopalmar value of the DDFT was more similar to that of the SL; whereas, that of the accessory ligament of DDFT was similar to that of the SDFT. At the 4th region, the DDFT had the highest value; whereas, at region 5, the SL lat. and SL med. had the highest values. At the first 3 regions, the values for the lateromedial width of the DDFT and SL were similar; the SDFT values were smaller, but increased over the regions, and the SDFT was the widest structure at region 5, followed by the DDFT, and the SL med. and the SL lat. All measurements from tendons and ligaments are summarized in Table 1.
4. Discussion
The obtained results were similar to our previous study [5] and other research studies [3, 4]. The equine was weight-bearing on all 4 limbs during standing and running. It is important that tendons and ligaments tension during the weight tolerance influences their Ultrasonographic appearance. Ultrasonography in the forelimbs of horses in a weight-bearing position is important; if the horses are not in this position, the tendons and ligaments can display artifacts that might be evaluated as lesions [13-15].
The obtained results were similar to our previous study [5] and other research studies [3, 4]. The equine was weight-bearing on all 4 limbs during standing and running. It is important that tendons and ligaments tension during the weight tolerance influences their Ultrasonographic appearance. Ultrasonography in the forelimbs of horses in a weight-bearing position is important; if the horses are not in this position, the tendons and ligaments can display artifacts that might be evaluated as lesions [13-15].
To evaluate the odds of injury in the forelimb tendons and ligaments, some parameters such as size, echogenicity, shape, and fibers’ patterns must be assessed. Evaluation of the echogenicity of tendon and ligament depends on the tools settings and the skill of operator. The best technique to identify the tendon and ligament injury is the cross-sectional area measurement of them. Thus, obtaining information about the normal measurements and echogenicity of tendons and ligaments in normal horses is important to detect the abnormal ones. Several studies assessed and described the tendons and ligaments in different horse breeds by Ultrasonographic technique. Measurements in other normal limbs in the same horse are the most useful reference for comparison [16]. Slight increase in the size of tendon or ligament with a change in their echogenicity without variation in fiber alignment reveals that horse has primary tendinitis or desmitis. This is almost the first sign of inflammation or injury in the tendon or ligament structures. The central part of a tendon or ligament is the weakest part of those [16, 17].
Ultrasonography is used as a standard diagnostic imaging technique for the assessment of musculoskeletal disorders in horses [18]. Evaluation of the morphometric variables in respect of cross-sectional area, circumference, dorsopalmar width, and lateromedial width is important for the detection of lesions in tendons or ligaments [19-21]. However, to use these values correctly, it is essential to recognize the standard values for the examined breed of horse [2]; there are considerable differences among breeds [8, 19]. Results of the present study are consistent with this statement, because the values found in the examined pure Persian Arabian horses differed from those reported for other breeds. The SDFT of Arabian horses appears to be larger than that of Icelandic horses [7]. The tendon seems to have a different shape in this breed, compared with Icelandic horses [7], because the cross-sectional area was larger at all regions, but the values for circumference and lateromedial width were almost the same in Thoroughbreds [8], and Icelandic horses [7] at regions 4 and 5.
A similar situation was found for the DDFT [8, 22]. In Thoroughbreds, the DDFT appears to be larger, whereas the values for Arabians were closer to those reported in the present study. The values for the 2 most distal regions were similar in Thoroughbreds and Icelandic horses; the values for the Icelandic horses were approximately 0.5 cm greater [7]. Based on some studies, Arabians have the lowest values in these 2 regions concerning the cross-sectional area and circumference [8, 19]. At region 1, values for the Icelandic horses in terms of cross-sectional area, and circumference was almost the same as those reported for Thoroughbreds and were similar to, or greater than those of Arabians [8, 19]. The DDFT was rather large at region 1 and at the distal regions, which probably reflect the hourglass shape, which seems to be more pronounced in Icelandic horses than in Thoroughbreds, Arabians, or Spanish horses [8, 19].
The accessory ligament of DDFT of the pure Persian Arabian horse was about the same size as reported for Thoroughbreds [8], and Icelandic horses [7]; however, the results differed at the 3rd region. The cross-sectional lateromedial width values for the body of the SL were larger in Arabians than Icelandic horses [7], but approximately similar to Thoroughbreds [8]. Dorsopalmar width values were smaller than those of Icelandic horses [7]. The SL lat. and SL med. values in our study were greater than those for Icelandic horses except for circumference, that are lower [8]. The values for pure Persian Arabians were generally lower; only the dorsopalmar width was approximately 0.15 cm larger in region 4 [8].
Compared with the ponies, the morphometric values for the Icelandic horses suggest that they have rather slim tendons [9]. The fact that the ponies used in the previous study [9] were not saddle trained is also a factor that has to be considered because training affects the cross-sectional area of the tendons of racing Thoroughbreds [9, 23].
The manner in which the different structures changed in size and shape from proximal to distal and in their dimensions relative to each other in Icelandic horses was consistent with that of other breeds described in the literature [8, 9, 19]. Only the branches of SL appeared to be larger than Icelandic horses, which might be caused by different strains associated with the special gait patterns and conformational traits of the breed. The cross-sectional area of the SDFT of Thoroughbreds decreased with age, but the findings of other authors [19] were strongly in line with the present study.
Our results from the 2nd region to level 6 suggested that the area of SDFT was higher in DDFT and SL. Based on the obtained results, there was no significant difference between values in the left and right forelimbs. This finding was in agreement with other studies on horses [9, 24]. Tension applied on tendons and ligaments can affect Ultrasonographic results; e.g. a non-weight bearing limb can cause Ultrasonographic images that might be misinterpreted as tendon lesions [13, 14]. To avoid such artifacts, Ultrasonographic measurements were only performed on the horses bearing full weight on all 4 limbs.
We overlooked evaluating the influence of age on the obtained results. However, based on the previous studies on the effect of different factors on age, the age is not associated with the tendons and ligaments at the distal part of the forelimb. For example, SDFT and ICL in the younger horses (up to 7) are higher than older ones. It is inconsistent with the data about the DDFT and SL in this age [15, 25]. The differences in relationship with age may be explained by changes in the extracellular matrix content. In contrast with these findings, some researchers believe that tendons and ligaments do not significantly relate with age [26, 7].
Our results suggested no significant difference between left and right forelimbs in this breed. Also, our measurements in the flexor tendons and ligaments of the palmar metacarpal region in pure Persian Arabian horse were approximately similar to those in other horse breeds. Furthermore, there were some regions in SDFT, DDFT, and AL that demonstrated significant differences with other regions.
Ethical Considerations
Compliance with ethical guidelines
This study was approved by the Animal Ethics Committee of the Research Council of the Veterinary School in Shahid Bahonar University of Kerman, Iran (Code: IR.UK.VETMED.REC).
Funding
This research was financially supported by the research council of Shahid Bahonar University of Kerman (Grant no.: 1.11.1393).
Authors' contributions
Conceptualization, Methodology, Funding Acquisition: Dariush Vosugh; Review and Editing: Mohammad Naser Nazem; Software: Mohammad Naser Nazem, Sogand Lahuti; Physical Examination: Sogand Lahuti.
Conflict of interest
The authors declared no conflict of interest.
Acknowledgments
The authors would like to thank Shabdiz Equestrian Club.
References
Archer R. The Arabian Horse. Galesburg, Michigan: The Crowood Press; 1992.
Reef VB. Superficial digital flexor tendon healing: Ultrasonographic evaluation of therapies. Veterinary Clinics of North America: Equine Practice. 2001; 17(1):159-78. [DOI:10.1016/S0749-0739(17)30081-0]
Budras KD, Sack WO, Rock S, Wunsche A, Henschel E. Anatomy of the horse. Hannover: Schlutersche Verlagsgesellschaft; 2009.
De Lahunta A, Habel RE. Applied veterinary anatomy. Philadelphia: Saunders Co; 1986.
Nazem MN, Sajjadian SM, Vosough D, Mirzaesmaeili A. Topographic description of metacarpal tendons and ligaments of anatomy donkey by ultrasonography and introducing a new ligament. Anatomical Sciences Journal. 2015; 12(4):153-60.
Genovese RL, Reef VB, Longo KL, Wade BJ, Davis WM. Superficial digital flexor tendonitis-long term sonographic and clinical study of racehorses. Proceedings of the Dubai International Equine Symposium. 1996; 14(3):P187-P206.
Boehart S, Arndt G, Carstanjen B. Ultrasonographic morphometric measurements of digital flexor tendons and ligaments of the palmar metacarpal region in Haflinger horses. Anatomia, Histologia, Embryologia. 2010; 39(4):366-75. [DOI:10.1111/j.1439-0264.2010.01003.x]
Çlelimli N, Seyrek-Intas D, Kaya M. Morphometric measurements of flexor tendons and ligaments in Arabian horses by Ultrasonographic examination and comparison with other breeds. Equine Veterinary Education. 2004; 16(2):81-5. [DOI:10.1111/j.2042-3292.2004.tb00271.x]
Smith RK, Jones R, Webbon PM. The cross-sectional areas of normal equine digital flexor tendons determined Ultrasonographically. Equine Veterinary Journal. 1994; 26(6):460-5. [DOI:10.1111/j.2042-3306.1994.tb04050.x]
Vosough D, Molaei MM, Masoudifard M, Karamouzian M, Hosseininejat F. Ultrasonography description of metatarsal tendons and ligaments of the Caspian miniature horse. Iranian Journal of Veterinary Surgery. 2007; 2(5):25-36.
Nyland G, Mattoon JS. Veterinary diagnostic ultrasound. Philadelphia: Saunders; 1995.
Denoix JM. The equine distal limb: An atlas of clinical anatomy and comparative imaging. Canadian Veterinary Journal. 2002; 43(11):879. [DOI:10.1201/b15219] [PMCID]
Micklethwaite L, Wood AK, Sehgal CM, Polansky M, Dowling BA, Dart AJ, et al. Use of quantitative analysis of sonographic brightness for detection of early healing of tendon injury in horses. American Journal of Veterinary Research. 2001; 62(8):1320-7. [DOI:10.2460/ajvr.2001.62.1320]
Smith RK. Tendon and ligament injury. Proceedings of the 54th Annual Convention of the American Association of Equine Practitioners. 2008; 54:475-501.
Wood AKW, Sehgal CM, Polansky M. Sonographic brightness of the flexor tendons and ligaments in the metacarpal region of horses. American Journal of Veterinary Research. 1993; 54(12):1969-74. [PMID]
Maoudifard M. Principles of ultrasonography of tendons and ligaments in the horse. Principles of Ultrasonography of Tendons and Ligaments in the Horse. 2008; 2008(Suppl. 2):72-81.
Vosugh D, Nazem MN, Hooshmand AR. Radiological anatomy of distal phalanx of front foot in the pure Iranian Arabian horse. Folia Morphologica. 2017; 76(4):702-8. [DOI:10.5603/FM.a2017.0028]
Genovese RL, Rantanen NW, Hauser ML, Simpson BS. Diagnostic ultrasonography of equine limbs. Veterinary Clinics of North America: Equine Practice. 1986; 2(1):145-226. [DOI:10.1016/S0749-0739(17)30738-1]
Agut A, Martínez ML, Sánchez-Valverde MÁ, Soler M, Rodríguez MJ. Ultrasonographic characteristics (cross-sectional area and relative echogenicity) of the digital flexor tendons and ligaments of the metacarpal region in Purebred Spanish horses. The Veterinary Journal. 2009; 180(3):377-83. [DOI:10.1016/j.tvjl.2008.01.012]
Pickersgill CH, Marr CM, Reid SW. Repeatability of diagnostic ultrasonography in the assessment of the equine superficial digital flexor tendon. Equine Veterinary Journal. 2001; 33(1):33-7. [DOI:10.2746/042516401776767494]
Schie HT, Bakker EM. Structure-related echoes in Ultrasonographic images of equine superficial digital flexor tendons. American Journal of Veterinary Research. 2000; 61(2):202-9. [DOI:10.2460/ajvr.2000.61.202]
Padaliya NR, Ranpariya JJ, Kumar D, Javia CB, Barvalia DR. Ultrasonographic assessment of the equine palmar tendons. Veterinary World. 2015; 8(2):208-12. [DOI:10.14202/vetworld.2015.208-212]
Gillis CL, Meagher DM, Pool RR, Stover SM, Craychee TJ, Willits N. Ultrasonographically detected changes in equine superficial digital flexor tendons during the first months of race training. American Journal of Veterinary Research. 1993; 54(11):1797-802. [PMID]
Gillis C, Meagher DM, Cloninger A, Locatelli L, Willits N. Ultrasonographic cross-sectional area and mean echogenicity of the superficial and deep digital flexor tendons in 50 trained thoroughbred racehorses. American Journal of Veterinary Research. 1995; 56(10):1265-9. [PMID]
Birch HL, Bailey JV, Bailey AJ, Goodship AE. Age-related changes to the molecular and cellular components of equine flexor tendons. Equine Veterinary Journal. 1999; 31(5):391-6. [DOI:10.1111/j.2042-3306.1999.tb03838.x]
Cherdchutham W, Meershoek LS, van Weeren PR, Barneveld A. Effects of exercise on biomechanical properties of the superficial digital flexor tendon in foals. American Journal of Veterinary Research. 2001; 62(12):1859-64. [DOI:10.2460/ajvr.2001.62.1859]
Type of Study: Original |
Subject:
Gross Anatomy
Received: 2018/07/10 | Accepted: 2019/02/23 | Published: 2019/07/1
Received: 2018/07/10 | Accepted: 2019/02/23 | Published: 2019/07/1
Send email to the article author
| Rights and permissions | |
 |
This work is licensed under a Creative Commons Attribution-NonCommercial 4.0 International License. |

Copyright © The Author(s);
This is an open access article distributed under the terms of the Creative Commons Attribution License (CC-By-NC), which permits use, distribution, and reproduction in any medium, provided the original work is properly cited and is not used for commercial purposes.
Contact Information